
A Forensic Record of Things Going Quietly Wrong
At 21:41 UTC on February 11, 2026, an AI agent designated W6-dashboard-fe completed its final change to a React frontend. It was one of eight worker agents, W-A, W-B, W-C, W-D, W1, W2, W5, and W6, that had spent the day building a platform health dashboard. They worked in parallel across two feature branches, creating 14 new files, modifying 6 existing ones, and producing 8 structured agent reports documenting everything they did.
Then nothing happened.
The Session Writer, the designated agent responsible for consolidating worker reports into a session capture, never ran. Nobody launched it. Nobody noticed it hadn't been launched. Eight agent reports sat in .claude/agent-reports/, orphaned, with no corresponding entry in session_capture/ or session_summary/. The work was done. The record of the work was incomplete.
Three days passed before anyone looked.
Here's the part that matters: every timestamp in the paragraph above, the 21:41 UTC completion time, the agent IDs, the file counts, the three-day gap, comes from the system we're about to describe. The platform was already capturing this data. Structured agent reports with ISO 8601 timestamps, standardised metadata fields, change tables, decision logs. The raw data was there the whole time.
We just couldn't see it.
The Numbers That Made the Problem Impossible to Ignore
By February 13, the GoldenPath Internal Developer Platform had accumulated a substantial governance corpus:
- 193 Architecture Decision Records
- 18 governance policies
- 14 operational runbooks
- 53 session captures
- 107 session summary entries
- 8 orphaned agent reports from two days earlier
All of it stored as markdown files with structured YAML frontmatter. All of it validated by CI on every pull request. All of it, in theory, available to anyone who knew which directory to look in and which file to open.
In practice, the documentation was functionally invisible. There was no consolidated view of agent activity. No way to see which multi-agent missions had completed successfully and which had been abandoned. No way to filter ADRs by status or domain without grepping through 193 files. No way to tell that eight agent reports were sitting orphaned without manually comparing the contents of agent-reports/ against session_capture/.
We didn't need more governance documentation. We needed the documentation to tell us what was happening.
This wasn't an academic observation. The same week, Entire.io, founded by a former GitHub CEO, raised a $60 million seed round for AI agent observability tooling. The commercial market was validating what we were experiencing firsthand: as organisations deploy more AI agents, the ability to observe, audit, and govern agent activity becomes a product category in its own right.
The difference was that we already had the data. The agent reports contained structured metadata, agent IDs, timestamps, objectives, branches, changes made, issues found. The governance corpus had typed relationships via relates_to frontmatter. The session memory architecture (working memory, long-term memory, historical archive) had been capturing institutional knowledge across agent sessions for weeks.
The problem wasn't data collection. The problem was data surfacing.
Building the Monitor With the Thing It Monitors
On February 14 at 00:00 UTC, we started building the governance portal. The irony was immediate and deliberate: we used the same multi-agent coordination protocol (ADR-0192) to build the tool that would enforce that protocol.
Phase 0: The Foundation (Sequential, Orchestrator)
Before launching any workers, the orchestrator laid groundwork that didn't exist yet:
AGENTS.md, a new root-level file containing universal agent rules. Previously, coordination rules lived in CLAUDE.md, which was specific to one tool. The new file was tool-agnostic. Any AI agent, Claude, Codex, Copilot, or a human following the same protocol, could read it and know the rules. One file. One source of truth. (The branch isolation discipline that made this possible — separating agents onto individual branches so no model shares state until a human reviews the diff — was first stress-tested when a Gemini agent changed 700 files without being asked.)
agent-reports/ directory, moved from .claude/agent-reports/ (tool-specific) to a top-level directory. Agent reports became a platform artifact, not a Claude artifact. This was the architectural decision that made the portal possible: agent reports are data, and data belongs to the platform.
ADR-0192 v1.1, the multi-agent coordination protocol was amended with three additions that would become the portal's data model:
- Mission ID: A unique identifier grouping all agents working on the same task. Eight agents building a dashboard are one mission, not eight sessions.
- Platform field: Which tool produced the report. The portal would track work across Claude, Codex, Copilot, and human sessions.
- Mandatory time tracking: ISO 8601 timestamps for Started and Completed. Not optional. CI would hard-block placeholder values like
{ISO8601}.
Pre-commit hook, scripts/check_session_writer.sh, the enforcement mechanism that would have caught the Feb 11 orphan incident. If agent reports are staged but no session capture is staged alongside them, the commit is blocked. Layer 2 of what would become a four-layer defence.
Total elapsed time for Phase 0: approximately 30 minutes. Zero tests, this was protocol and infrastructure, not application code.
Phase 1: Two Agents, One Mission (Parallel)
With the foundation in place, two worker agents launched in parallel:
W1-portal-backend (00:00–01:00 UTC) built the FastAPI backend on port 8002. The core abstraction was the session_activity.py collector, a module that reads every agent report in the repository, parses the metadata and tables, groups reports into missions, matches missions against session captures, and classifies each mission as complete, orphaned, or in-progress.
The Mission model was the key design decision:
{
    "id": "governance-portal-2026-02-14",
    "type": "swarm",           # 2+ agents = swarm, 1 agent = solo
    "status": "complete",       # has matching session capture
    "agent_reports": [...],     # individual worker reports
    "duration_minutes": 60,     # wall-clock: earliest start → latest end
    "total_agent_minutes": 65,  # sum of parallel effort
}
A swarm of eight agents is one unit of work, not eight sessions. This seems obvious in retrospect. It wasn't obvious before we built it. Previous session tracking was linear, one session, one capture. Multi-agent work broke that model because eight workers and a session writer produce nine reports for what is logically one mission.
W1 delivered three endpoints (GET /health, GET /api/sessions, POST /api/refresh), Pydantic v2 models, and 23 passing tests in 0.23 seconds.
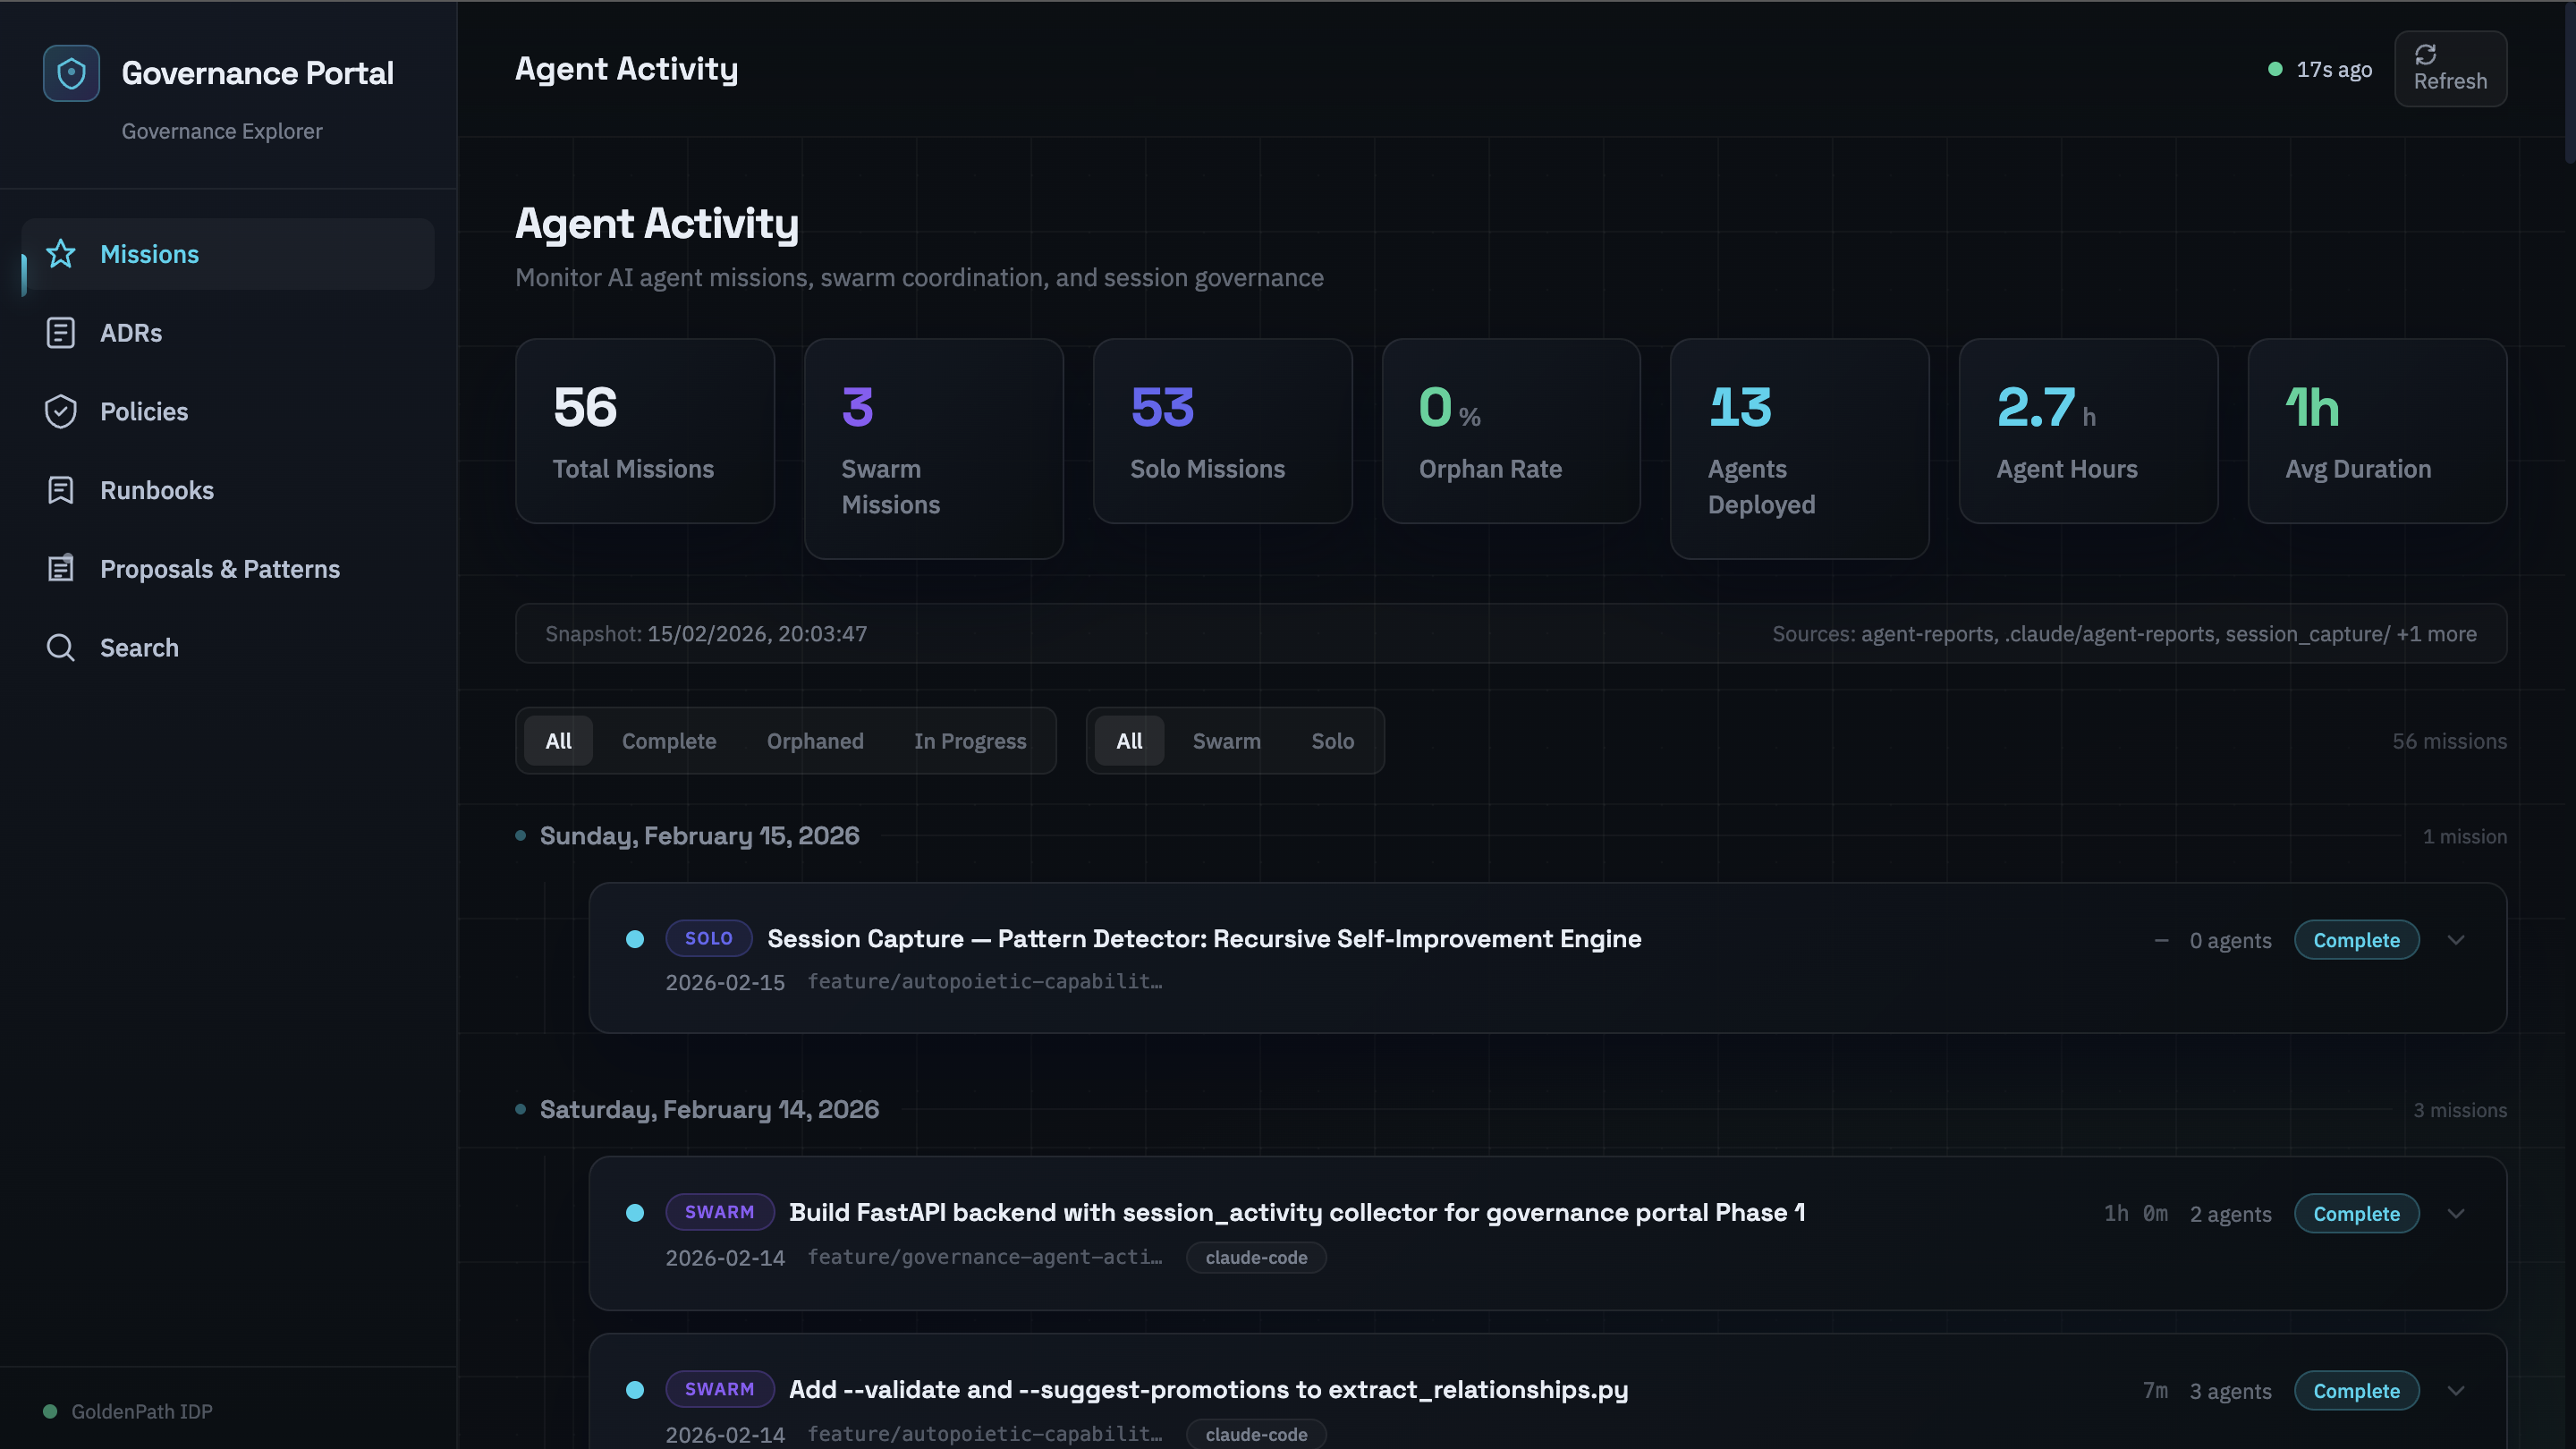
W2-portal-frontend (00:38–00:43 UTC) built the React UI. Five minutes of agent execution time. The frontend used React 18, TypeScript, Vite, Tailwind CSS, and Framer Motion. Port 3002, no conflict with the RAG web UI on 3000 or the platform dashboard on 3001.
The Agent Activity page rendered missions as expandable cards on a timeline. Stats row across the top: total missions, swarm count, solo count, orphan rate, agents deployed, total agent hours, average mission duration. Status filters (All / Complete / Orphaned / In Progress) and type filters (All / Swarm / Solo) with real-time counts.
The aesthetic was deliberate: dark tech noir. Deep navy backgrounds, glassmorphism cards with gradient borders, glow hover effects, staggered entrance animations. Not because dashboards need to look cool, because this portal was being evaluated as a potential product, and products need a design language. The design system was a bet, not a decoration.
W2 delivered 16 passing tests in 1.14 seconds, and a production build of 293 KB JavaScript and 17 KB CSS.
Phase 1 total: 39 tests, 0 failures. The Session Writer consolidated both worker reports into a session capture. This time, it ran.
The Build Accelerates (Sessions 2–4)
Once the core was working, the pace changed. The detailed back-and-forth of foundation-laying gave way to something closer to assembly, each session adding a major subsystem on top of infrastructure that already existed.
02:15 UTC, A code review (run through Codex) surfaced four high-severity issues. The timing stats were being computed but dropped from the API response. Legacy mission grouping was merging unrelated work because it keyed on branch name alone, two missions on the same branch from different days became one mission. The CI timestamp gate was scanning the wrong directory. The pre-commit hook wasn't wired into .pre-commit-config.yaml. All four fixed within the session.
03:20 UTC, Phase 2: Governance Explorer. Four new pages in a single session. An ADR index with filtering by status, domain, and owner. A policy dashboard with severity distribution. A runbook registry with maturity indicators. A full-text search across all governance artifacts. Each page backed by its own collector, its own endpoint, its own test suite.
Test count went from 39 to 170. Backend: 122 tests in 0.81 seconds. Frontend: 48 tests in 3.28 seconds. All passing. One day of work.
03:30–04:10 UTC, The Session Writer orchestrated a four-branch coordinated merge. PRs #374 through #377, representing the governance portal, a RAG query rewriter, governance documentation updates, and cross-branch tooling improvements. Seven merge conflicts, all formatting and metadata, zero logic conflicts. All four PRs merged to the development branch.
The Loop Closes
The governance portal didn't just visualise agent activity. It created a feedback loop with four enforcement layers, each catching what the previous one missed.
Layer 1: Prevention
AGENTS.md contains the rule: "After all worker agents complete, the orchestrator MUST launch the Session Writer." This is a human-readable instruction. It works when agents read and follow their instructions. It fails when someone forgets, or when the orchestrator session crashes before reaching that step.
Prevention is necessary. Prevention is not sufficient.
Layer 2: Catch
The pre-commit hook (check_session_writer.sh) runs locally before every commit. If the git staging area contains modified agent reports but no modified session capture files, the commit is blocked with a clear message:
SESSION WRITER NOT RUN, 1 orphaned agent report(s)
This catches the failure at the earliest possible point, before the code leaves the developer's machine. On February 11, this hook didn't exist. Now it does. The orphan incident that inspired the portal also inspired the gate that prevents the next one.
Layer 3: Safety Net
Three CI workflows form the remote safety net:
Issue severity SLA gate, every agent report must contain a ## Issues Found section. Not "should contain." Must. The CI workflow scans every report in agent-reports/ and .claude/agent-reports/, and fails the PR if any report omits the heading. Agents must explicitly declare their issues or state "No issues found." Silent omission is not an option.
Timestamp validation, ISO 8601 timestamps in the Started and Completed fields are validated. Placeholder values like {ISO8601} are rejected. The system requires real data, not templates.
Severity SLA enforcement, critical and high-severity issues cannot use the defer-to-roadmap resolution. They must be fix-now or needs-human. CI blocks the PR if an agent tries to defer a critical issue. Medium-severity issues get a 30-day resolution window with automatic escalation.
Layer 4: Visualise
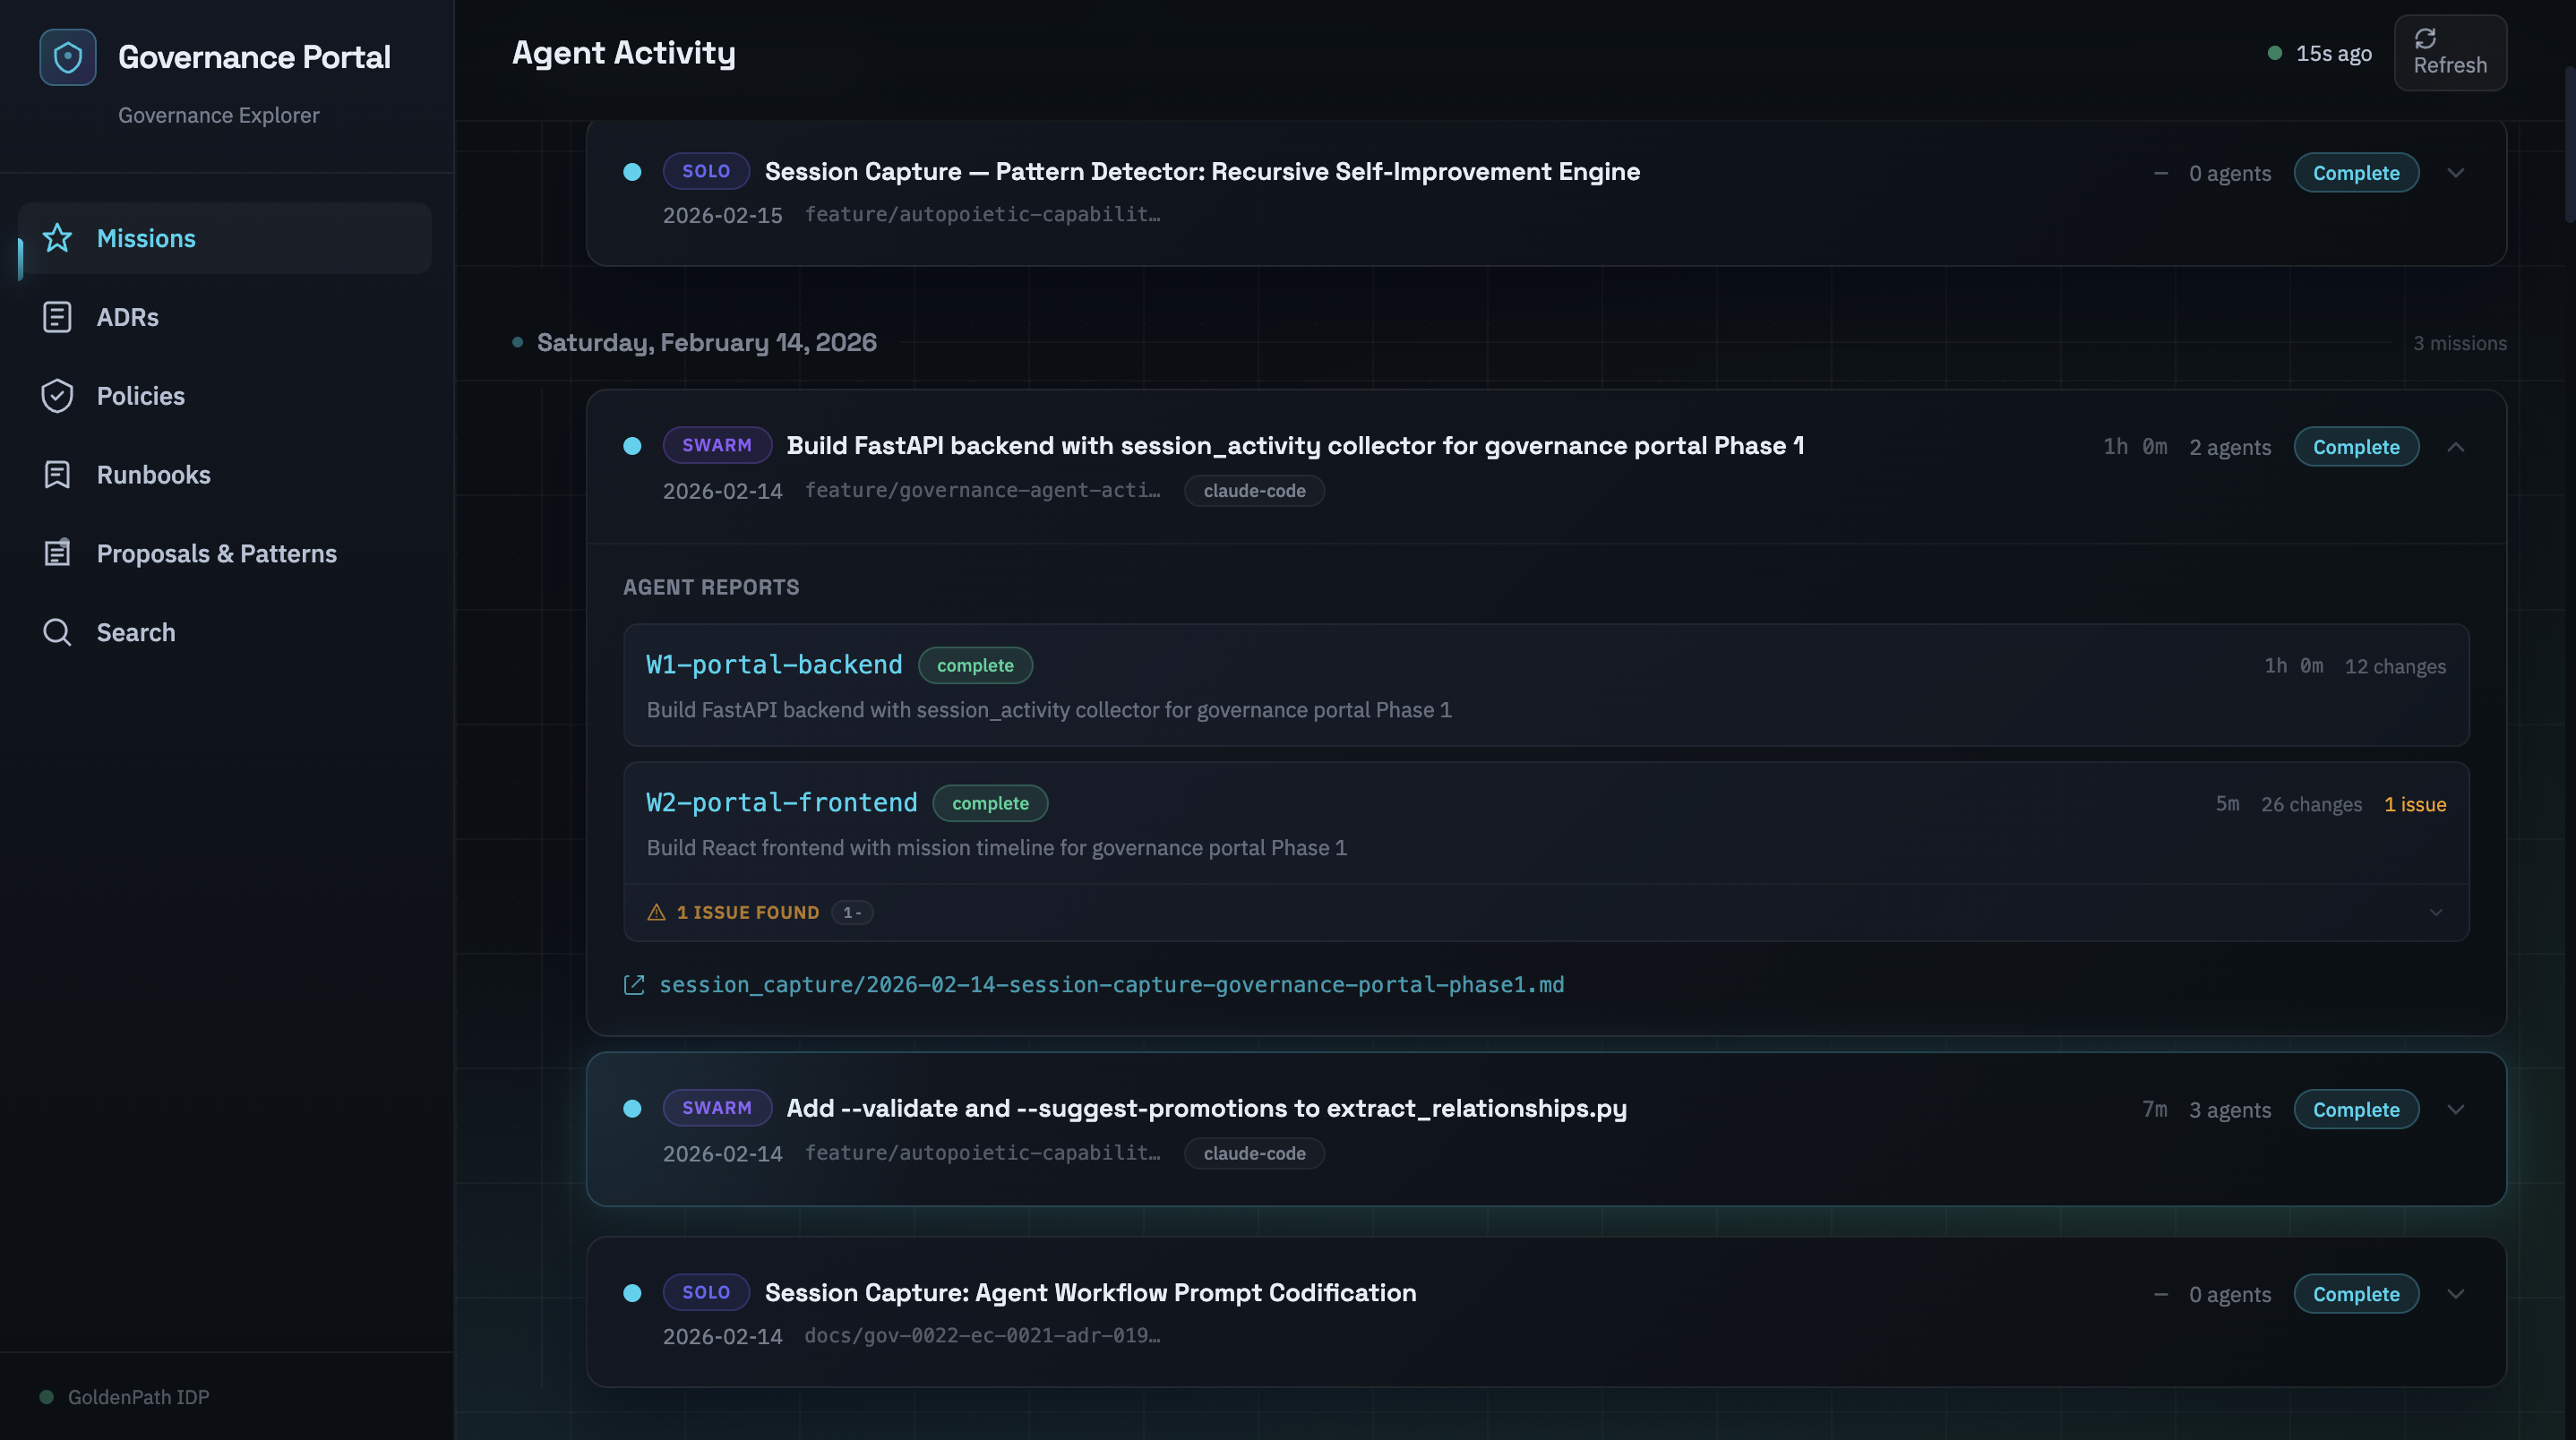
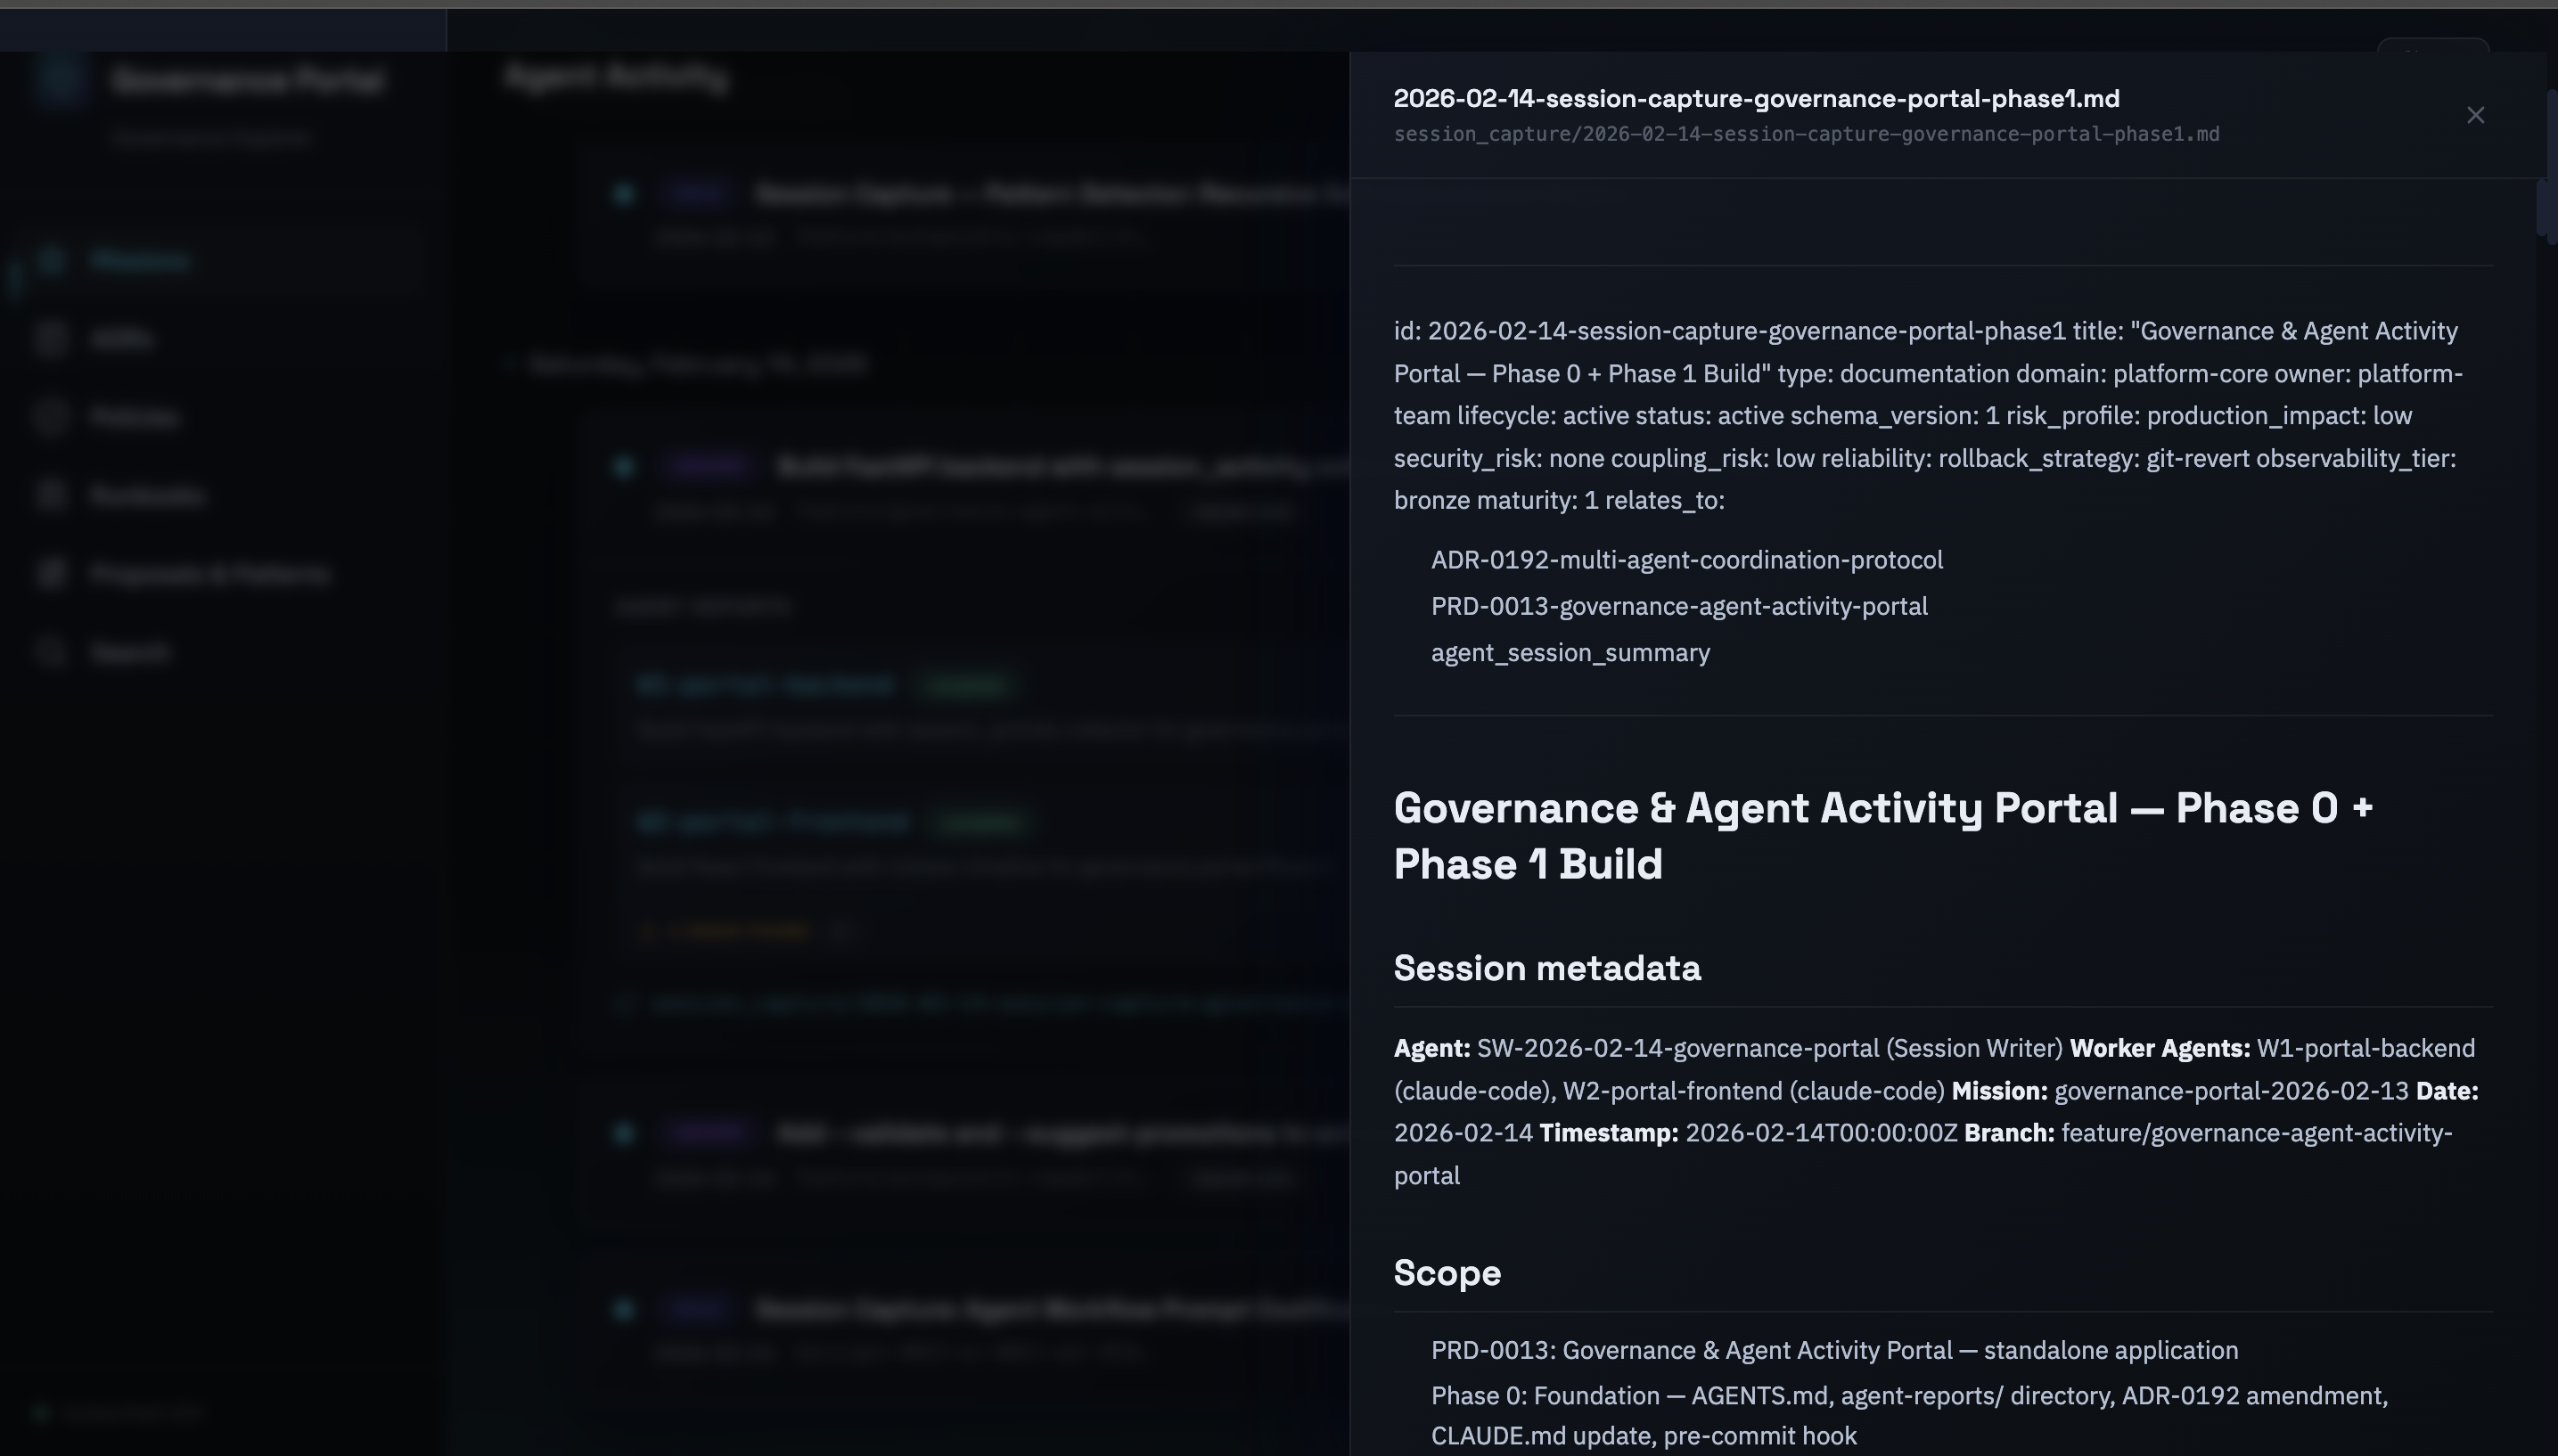
The portal itself. Orphaned missions appear with amber warning badges and diagnostic messages. The stats row shows an orphan rate percentage. You can filter to see only orphaned missions. The Document Viewer lets you click through to the actual agent reports and session captures.
The value of Layer 4 is different from Layers 1–3. Those layers block and enforce. Layer 4 creates awareness. A pre-commit hook says "you can't do this." A dashboard says "this is what's happening across the whole platform." One is a gate. The other is a mirror.
The Feb 11 orphaned reports? The portal found them. On its first run. The system built to detect orphaned work detected the orphaned work that inspired its creation.
What the Portal Actually Changed
On February 15, one day after the portal shipped, PR #379 landed on the development branch. It carried the usual payload: new capabilities, governance updates, documentation. It also carried six agent reports that were missing their ## Issues Found sections and seven reports with incomplete metadata, missing Mission IDs, missing timestamps, missing the fields that ADR-0192 had made mandatory forty-eight hours earlier.
The CI caught all of it. The severity SLA gate rejected the six incomplete reports. The timestamp validator flagged the seven with missing metadata. The PR couldn't merge until every report was fixed.
Here's what matters about that sequence: a human didn't find those issues. A human didn't need to. The pre-commit hook flagged the metadata gaps at commit time. The CI gate caught the missing sections at PR time. The portal showed the full picture, thirteen reports across two directories, each one needing specific fixes, all visible on a single page.
The human's role was to decide how to fix them, not to discover they were broken. That's the shift. Not replacing human judgement, relocating it. Instead of spending forty minutes comparing directory listings and grepping through YAML frontmatter, the human spent forty minutes on the actual decisions: which reports needed full metadata backfills, which ones could use # SKIP-TDD markers with pointers to existing tests, whether the Session Writer should run again or whether appending to the existing session capture was sufficient.
The portal didn't automate the review. It automated the discovery that makes review possible.
The Platform Starts Recommending Its Own Improvements
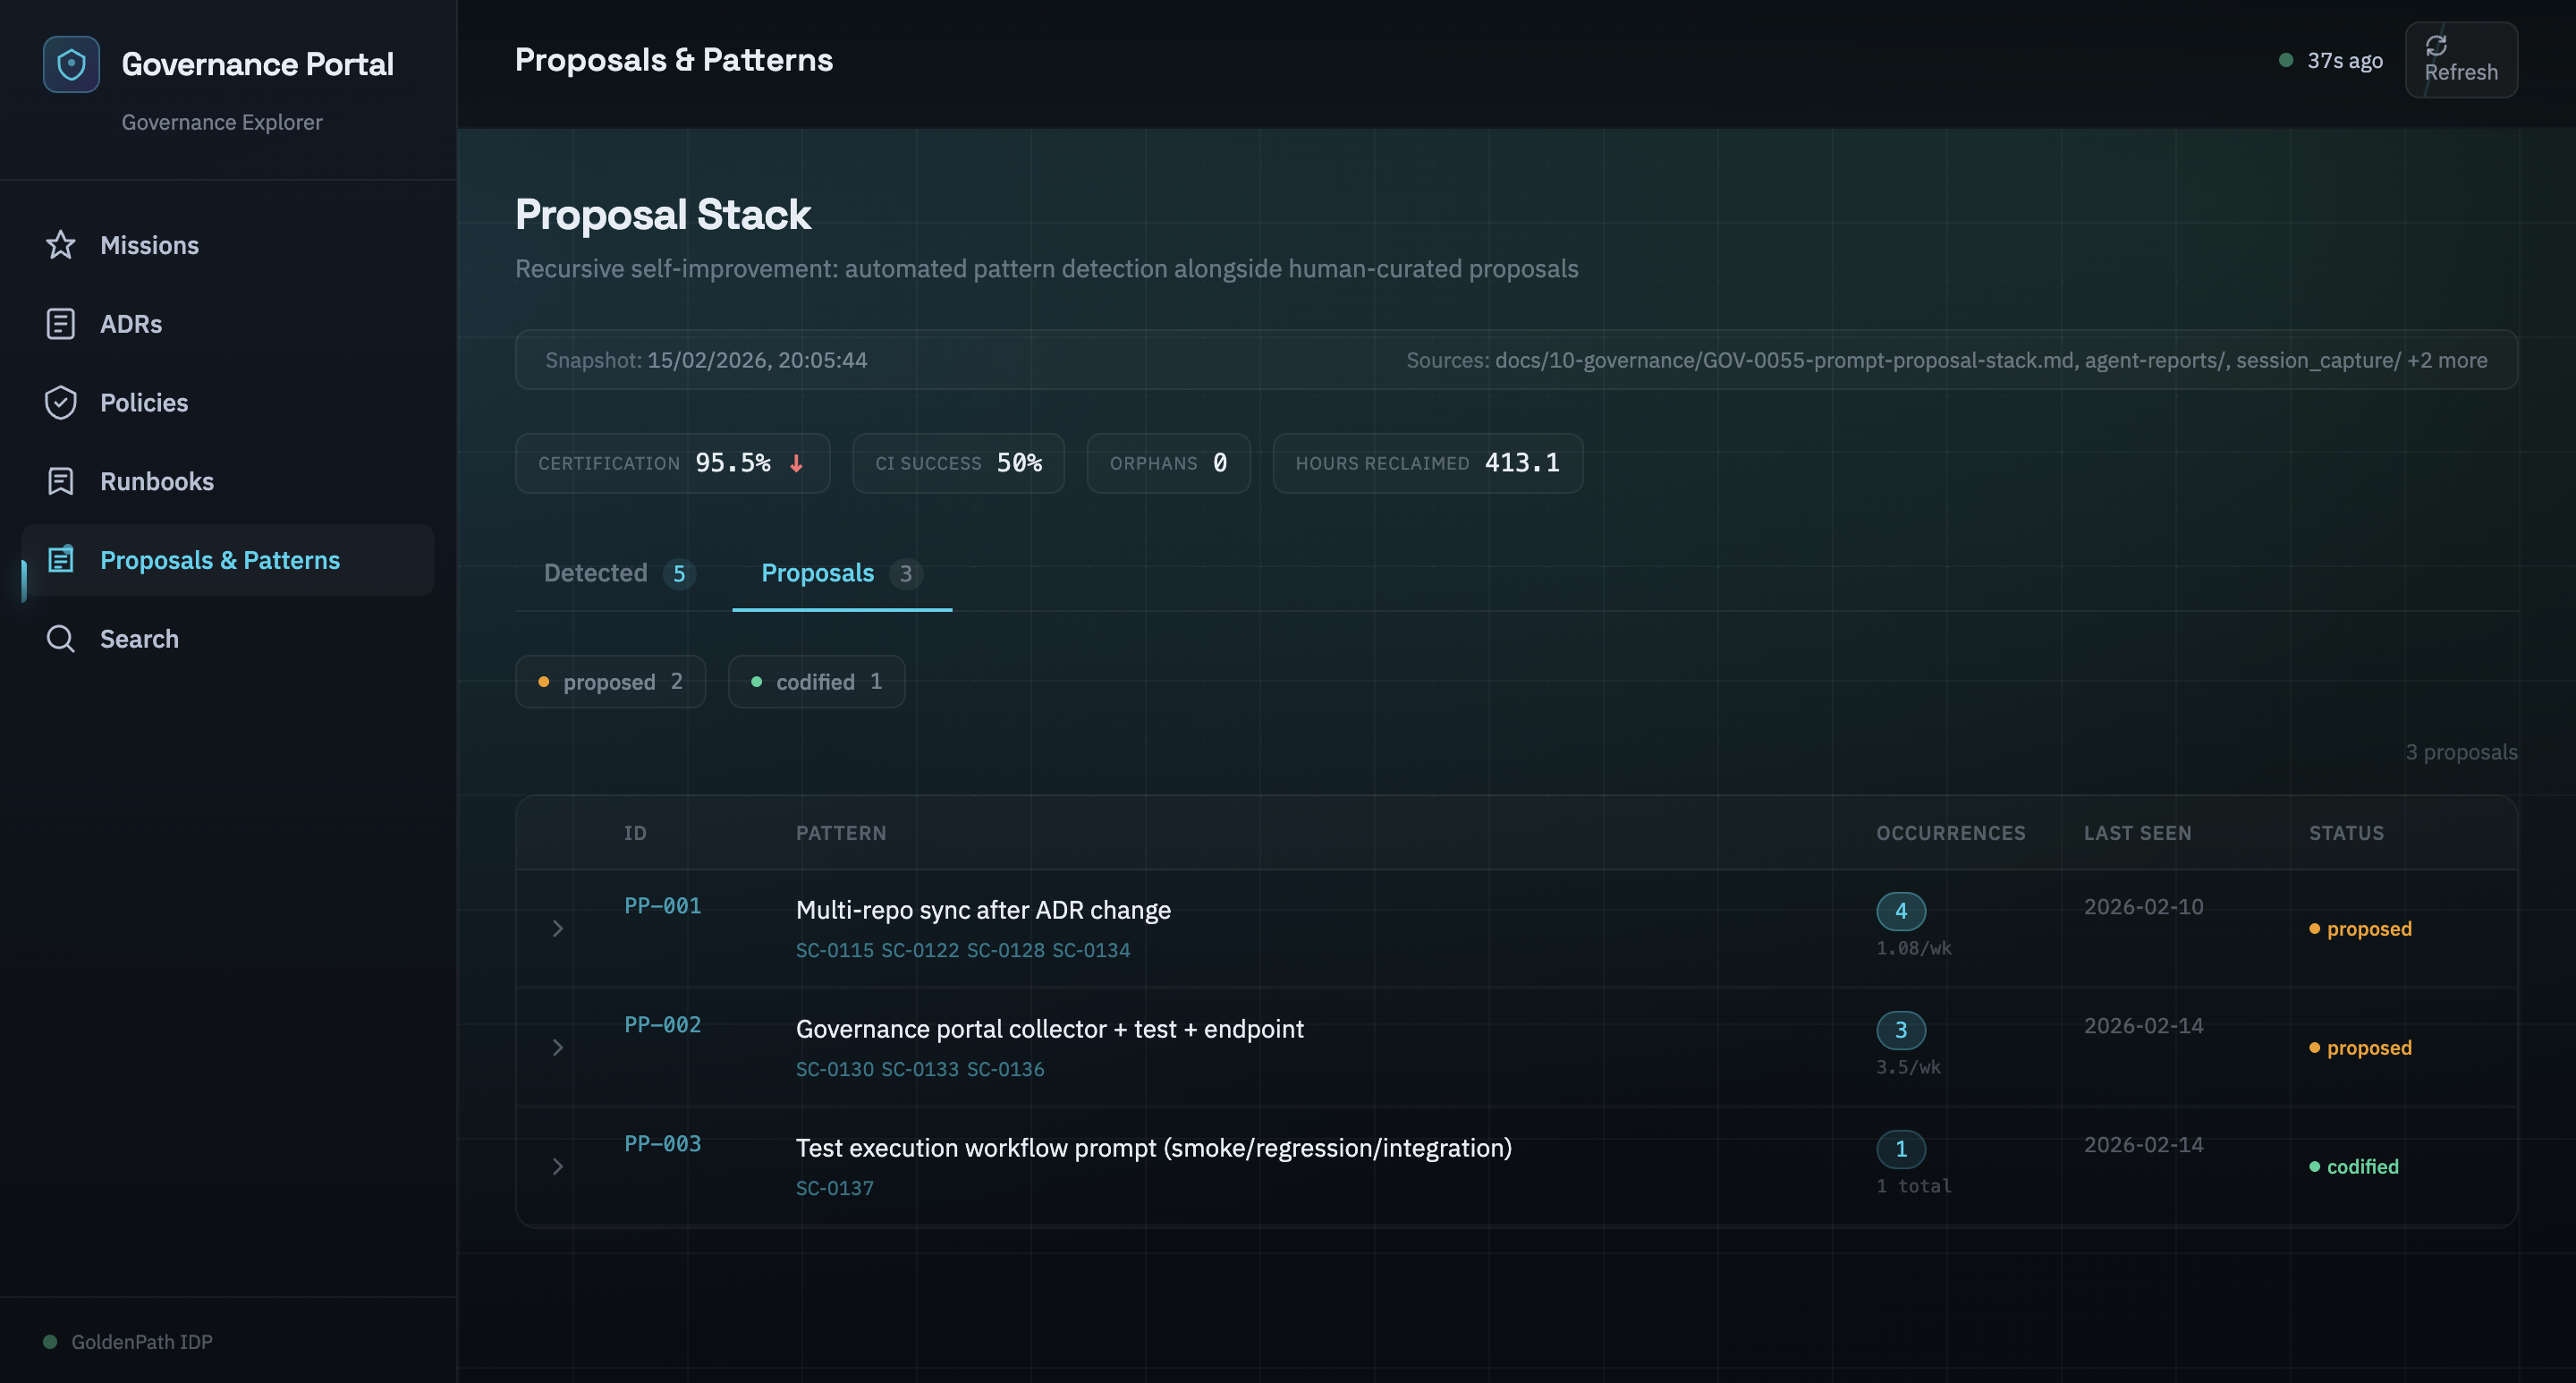
The portal crossed a threshold when we added the proposal stack.
The proposal stack collector scans session data for repeated workflow patterns, things agents do over and over that haven't been codified into prompt templates. When the same pattern appears in three or more sessions, the system flags it as a candidate for promotion.
PP-001 through PP-007: seven patterns the system identified in its own behaviour. Repeated PR creation workflows. Repeated session documentation steps. Repeated test execution sequences. Each one a candidate for a new prompt template that would standardise the workflow and reduce variance across agent sessions.
The portal wasn't just monitoring anymore. It was analysing its own operational patterns and suggesting improvements. The platform had started watching itself.
This is the autopoietic angle, a system that participates in producing and maintaining itself. Not in the philosophical sense. In the engineering sense. The governance portal detects orphaned missions, enforces issue tracking, surfaces timing data, and identifies workflow patterns worth codifying. Each of those capabilities feeds back into the platform's ability to govern the next round of agent work.
The Capability Ledger, a structured inventory of every platform capability, now includes entries #27 and #28: the governance portal itself and the issue tracking enforcement it enables. The ledger tracks capabilities. The portal is a capability. The portal is in the ledger it helps maintain.
Self-reference isn't a bug. It's the design.
Where It Goes Next
The current portal has five pages, six collectors, 170 tests, and a four-layer enforcement stack. It's useful. It's not finished.
Relationship graph visualisation, the ADR index currently shows a flat table. The metadata already contains relates_to edges between 193+ ADRs. A force-directed graph (react-force-graph) would make dependency clusters visible at a glance. Click a node, see what breaks if it changes. The edges are already in the data. The visualisation is the remaining work.
Automated issue bridge, SCRIPT-0086 (auto_create_issues_from_governance.py) closes the gap between portal detection and GitHub Issues. When the portal identifies an orphaned mission or a deferred issue, the script can auto-create a GitHub Issue with ADR-0193 labels, severity classification, and resolution tracking. Detection becomes action without manual intervention.
Recursive self-improvement engine, the pattern detector currently flags repeated workflows. The next step is generating draft prompt templates from detected patterns, submitting them for human review, and promoting approved templates into the prompt registry. The platform identifies what it does repeatedly, proposes how to standardise it, and, with human approval, codifies the improvement.
The second consumer test, composability is only proven when the second consumer works. The governance portal is consumer #1 of the agent report data model. Consumer #2 might be a Slack integration that posts mission summaries. Consumer #3 might be a cost attribution system that maps agent hours to project budgets. If the data model only works for the portal, it's not a platform primitive, it's a feature. We'll know which one it is when consumer #2 ships.
The Meta-Point
This article cited 14 specific timestamps, 12 agent identifiers, 4 commit references, and exact test counts from a four-day period of platform activity. None of that came from someone's memory or a retrospective document. All of it came from the structured data that the platform's governance system captures on every agent interaction.
That's the product.
Not the dashboard. Not the glassmorphism cards. Not the Framer Motion animations. The product is that your platform engineering team can reconstruct exactly what happened, when, by which agent, with what results, weeks or months after the fact, because the system was designed to capture that data as a first-class concern.
Most platforms treat agent observability as a nice-to-have. Something you'll add later, once the agents are productive. The GoldenPath experience suggests the opposite: observability is the prerequisite for productivity. You can't improve what you can't see. You can't trust what you can't audit. And you can't scale agent work past a handful of tasks until you have a system that tells you, at a glance, whether the Session Writer ran.
At 21:41 UTC on February 11, it didn't. Now the platform knows.
Next in this series: the multi-agent coordination protocol (ADR-0192) that makes all of this data possible, mission models, naming conventions, time tracking, and the Single Writer Rule.
Building multi-agent workflows and struggling with observability? Get in touch, we'd love to compare notes.